
Deep-sea water sampling
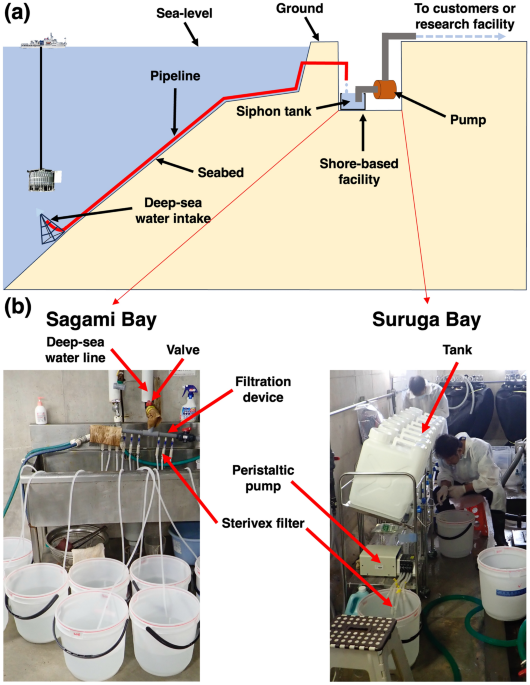
Deep-sea water samples were collected from two deep-sea water pumping facilities located in Akazawa, Shizuoka (facing Sagami Bay; owned by Akazawa Onsen Village, previous owner, DHC Corporation; pumping depth: 800 m) and Shizuoka Prefecture at Yaizu, Shizuoka (facing Suruga Bay; owned by Shizuoka Prefecture; pumping depth: 400 m) along the Pacific coast of Central Japan (Supplementary Fig. 1 and Supplementary Table S1). The inlet of the pumping station in Sagami Bay is situated approximately 2 m above the seafloor. In contrast, in Suruga Bay, the pipeline from the pumping station was ruptured by an earthquake prior to this study, resulting in the intake lying directly on the seafloor. Deep-sea water samples were collected directly from the deep-sea water pumping stations (hereafter, referred to as the “pump method”) and 10 m above the inlet of the deep-sea water pumping station using Niskin bottles (hereafter, referred to as the “Niskin method”). Within each broad sampling period, the sampling dates for the two methods were 1–11 days apart, with all collections performed during the daytime (approximately 9:00 AM to 3:00 PM; Supplementary Table S1). Thus, the influence of DVM on the eDNA profiles is expected to be minimal. Water collection was conducted using a previously reported pump method8. The pumped deep-sea water was collected directly from the faucet located at the most upstream outlet within the pumping stations. Based on previously reported filtration volumes8, 20 L of deep-sea water per filter in Sagami Bay was directly filtered using a filtration device that utilised the pressure differential resulting from the height difference between the sea level and outlet (Fig. 1). Similarly, at the Suruga Bay pumping station, 10 L per filter was collected in November 2019, February 2020, August 2020, November 2020, and April 2021, stored in a tank, and then immediately filtered on site using a peristaltic pump (Masterflex L/S peristaltic pump with Masterflex L/S multi-channel cartridge pump head and L/S 17G tubing, Masterflex, Radnor, PA, USA) (Fig. 1). We consider the risk of eDNA degradation during transit to be minimal, as the water is transported through a closed pipeline, maintained at stable deep-sea temperatures, and immediately filtered upon reaching the pumping station. For all samples, a Sterivex filter cartridge (0.45-µm pore size, PVDF membrane, gamma irradiated, sterile, SVHVL10RC, Merck KGaA, Darmstadt, Germany) was utilised for filtration. Before use, all filtration equipment used in this study was sterilised by immersion in 1% or 6% chlorine-based commercial bleach (Kao Co., Tokyo, Japan) and washed thoroughly with pumped deep-sea water or ultrapure water. For the Niskin method, water samples were collected 10 m above the inlet at the stations. This method was conducted using 36 Niskin bottles (12 L per bottle) mounted on a CTD frame on the research vessel (RV) Kaimei in November 2020 at both stations during the KM20-09 research cruise. In Suruga Bay, additional sampling was conducted on the fishing boat Chokane Maru in November 2019, February 2020, August 2020, and April 2021, with three sampling events conducted within a single day in each period, each using a single 12 L Niskin bottle. At Chokane Maru, Niskin bottles were sterilised with 6% chlorine-based commercial bleach before collection and immediately covered with a clean bag after collection to prevent contamination from the ship. Based on these optimised filtration volumes for the pumped method8, the Niskin method was designed to minimise the volume difference between the two sampling approaches within the physical constraints of the 12 L Niskin bottles. A total of 24 L (two bottles) and 12 L (one bottle) of deep-sea water collected from Sagami and Suruga bays, respectively, were also filtered through Sterivex filter cartridges on board Kaimei or at the home port (Yaizu port) of Chokane Maru using a peristaltic pump. After filtration by pumped and Niskin methods, approximately 2.0 mL of RNAlater (Thermo Fisher Scientific, Waltham, MA, USA) was immediately added to each cartridge through the inlet to prevent eDNA degradation, and the inlet and outlet were capped. After filtration, the Sterivex cartridges were stored at 4 °C at the stations and Chokane Maru or − 30 °C onboard until the samples were returned to the laboratory. All the samples were stored at − 30 °C in the laboratory until eDNA extraction. Negative control samples were used to ensure the validity of our eDNA analysis. As a negative control, during filtration, 20 or 10 L of ultra-purified water (Milli-Q), which was filled in a single-use sterilised plastic bag (Sekisui Seikei Co., Ltd., Osaka, Japan), was passed through a Sterivex filter cartridge with a peristaltic pump. An infiltrated Sterivex filled with RNAlater was used as a negative control (eDNA elution blank; EB) at each collection site.
DNA extraction, library preparation, and sequencing
eDNA extraction from the Sterivex cartridge, library preparation including two-step PCR for metabarcoding of fish in eDNA using two universal primer sets, and MiSeq sequencing were performed according to previous studies8,17,28. For eDNA extraction, the filtration membrane within Sterivex filter cartridges was removed, cut into pieces for lysis, and eDNA was extracted as described previously28. Library preparation, including a two-step PCR for fish metabarcoding, followed a previous method28 based on Miya et al. 201517. In the first round, a multiplex PCR assay targeted the mitochondrial 12S rRNA gene using two universal primer sets. The primer sequences with linkers were as follows: 5ʹ-ACACTCTTTCCCTACACGACGCTCTTCCGATCT-NNNNNN-GTCGGTAAAACTCGTGCCAGC-3ʹ (MiFish-U-Forward), 5ʹ-ACACTCTTTCCCTACACGACGCTCTTCCGATCT-NNNNNN-GTTGGTAAATCTCGTGCCAGC-3ʹ (MiFish-E-Forward), 5ʹ-GTGACTGGAGTTCAGACGTGTGCTCTTCCGATCT-NNNNNN-CATAGTGGGGTATCTAATCCC-3ʹ (MiFish-U-Reverse), 5ʹ-GTGACTGGAGTTCAGACGTGTGCTCTTCCGATCT-NNNNNN-CATAGTGGGGTATCTAATCCTAGTTTG-3ʹ (MiFish-E-Reverse)17. Comprehensive technical details regarding eDNA extraction, library preparation, and sequencing are provided in the Supplementary Method. The raw sequencing data were deposited in the NCBI sequence read archive (SRA) under the BioProject number PRJDB18791. Amplicon raw sequence data processing was conducted using PMifish ver. 2.4.1 (available at https://github.com/rogotoh/PMiFish.git)29,30 and USEARCH version 11.0.66731. Initially, raw paired-end reads were merged, excluding those with low quality (Q score < 2) or short length (< 100 bp) after tail trimming. Merged reads with discrepancies exceeding 5 bp in the aligned region were discarded. Following primer sequence removal, reads with an expected error rate above 1% or those shorter than 120 bp were filtered out. The sequences were then dereplicated to obtain unique sequences, with singletons, doubletons, and tripletons eliminated to prevent false positives31,32. These unique sequences were processed to generate amplicon sequence variants (ASVs), with chimeric and erroneous sequences removed33. Furthermore, sequences for each sample were filtered to remove all ASVs that occurred only once in the study, as well as samples containing only a single ASV, to avoid outliers that might bias the results34.
Taxonomic assignment of these ASVs followed a previously established protocol to define molecular operational taxonomic units (MOTU)29,30. ASV sequences with identities greater than 98.5% that formed a monophyletic clade with a reference sequence were assigned that species name. ASV sequences with identities between 80% and 98.5% were assigned the prefix “U98.5_” followed by the name of the species with the highest identity. ASVs with sequence identities lower than 80% were removed from the taxonomic assignment. Each ASV in a monophyletic clade of species belonging to a particular genus was assigned the genus name followed by “sp.” with a sequential number (e.g., Lepidotrigla sp. 1, sp. 2). Each ASV in a monophyletic clade of a particular family but not in a particular genus was assigned the family name followed by “sp.” with a sequential number (e.g., Synaphobranchidae sp. 1, sp. 2 or U98.5_Myctophidae sp. 1, U98.5_Myctophidae sp. 2) (Supplementary Tables S2–1, S2–2, and S2–3). Hereafter, the terms “MOTU” and “species” are used interchangeably. All ASV sequences generated in this study are provided in the Supplementary Data.
Statistical analysis
All statistical analyses were conducted using R 4.4.235, run in RStudio v2024.12.0 + 46736. To assess the effect of sampling effort on the number of species detected, accumulation curves and Chao indices were calculated and plotted for the number of ASVs detected by the two water collection methods at each site using the iNEXT v3.0.1 package in R37. The difference between the accumulation curves for the two water collection methods was compared using the “EcoTest.sample” function of rareNMtests v1.2 package in R38. Venn diagrams showing the differences in species composition between the water collection methods at each site were illustrated using the eulerr v7.0.2 package in R39,40. Chord diagrams comparing fish MOTUs between the different collection methods were constructed using the circlize v0.4.16 package in R41. Hierarchical clustering based on the Jaccard index, which uses presence-absence data, was constructed using the unweighted pair group method with arithmetic mean (UPGMA) via the hclust function in R. The differences in fish composition between the water collection methods were visualised using three-dimensional non-metric multidimensional scaling (NMDS) analysis based on the presence/absence of MOTUs in individual samples from Sagami and Suruga bays. NMDS analysis was performed using the Jaccard distance with the metaMDS function in the vegan v2.6.842 package in R, with three dimensions (k = 3). Permutational multivariate analysis of variance (PERMANOVA) tests were performed using the adonis function in vegan to assess fish community structures between the two water collection methods. For PERMANOVA, Jaccard similarity matrix was used and statistical values with 99,999 permutations were calculated. Significant differences in dispersion between the two water collection methods were tested using PERMDISP to aid in the interpretation of PERMANOVA results, implemented via the betadisper function in the vegan package. To account for temporal variation across the five distinct sampling periods in Suruga Bay, a multifactorial PERMANOVA was also performed with sampling method and sampling period as factors. The analysis was based on a Jaccard distance matrix with 99,999 permutations, and marginal effects were calculated to assess the independent contribution of each factor. We compared the differences in the number of ASVs detected by the two water collection methods at each site using the Mann–Whitney U test in the coin package v1.4–3 in RStudio. Pearson’s correlation coefficient analysis was performed to evaluate the effect of filtration volume on the number of detected ASVs in RStudio. To account for the potential random effect of sampling period in Suruga Bay, a generalised linear mixed model (GLMM) was applied to the ASV richness data using the “glmer” function in the lme4 package (version 2.0–1)43. In this model, the number of detected ASVs was used as the response variable, the sampling method as a fixed effect, and the sampling period as a random effect, assuming a Poisson distribution. To evaluate whether the two sampling methods consistently captured the biodiversity of the fish community at the sampling depth and to investigate potential biases in species detection, we analysed the habitat depth ranges of MOTUs identified at the species level using the habitat depth records available in FishBase. A Kruskal–Wallis test was performed to determine the differences in habitat depth of fish species detected by the two water collection methods using the coin package v1.4–3 in R. Differences were considered statistically significant at p < 0.05. Graphics were constructed using ggplot2 v3.5.1 in R44.
Baited camera system
Fish observations were conducted using a baited camera system to compare results with fish biodiversity detected by eDNA analysis. During the KM20-09 cruise of R/V Kaimei in November 2020, free-fall baited camera systems, called BCMs, were deployed around the inlet of the deep-sea water pumping stations in Sagami (800 m depth) and Suruga (400 m depth) bays and recovered by KM-ROV 1–2 days later. One cast of two BCMs in Sagami Bay and two casts of two BCMs in Suruga Bay were conducted (Supplementary Table S3), and an approximately 6–12 h video was acquired at the bottom of each cast.
In November 2019, February 2020, August 2020, and April 2021, three BCMs moored with a rope and a buoy were deployed at the inlet of the deep-sea water pumping station in Suruga Bay and recovered via the rope using the fishing boat Chokane Maru (Supplementary Table S3). A total of 26 casts were conducted to obtain 2–8 h videos for each cast.
The BCM was equipped with a digital still camera (DSC-RX0; Sony, Tokyo, Japan), and two LED flashlights (model no. OL0183; KC Fire, Guangdong, China), three aluminium alloy housings for the camera and flashlights, an electromagnetic current profiler (Infinity-EM; JFE Advantech, Nishinomiya, Japan); a miniature salinity, temperature, and depth logger (DST-CTD; Star-Oddi, Garðabær, Iceland), an acoustic release transponder (STE; Kaiyo Denshi, Tsurugashima, Japan), an ROV Homer (Sonardyne International, Yateley, UK), a stainless-steel bait cage containing approximately 1.0 kg of frozen mackerel, a syntactic foam (TG2000; Trelleborg AB, Trelleborg, Sweden), and a stainless steel frame. All the data, including video footage, were recovered upon retrieval of the system. All animals observed by the video camera were identified to the most specific taxonomic level possible, ideally to the species level, but at least to the family level. The population density (N) of each species appearing in the videos was estimated using the first arrival time (Tarr) according to the method outlined by Priede and Merrett (1996)45. These estimations were utilised for comparative validation with the eDNA results. Although mackerel was utilised as bait for the camera observations, detections of Scombridae (taxa closely related to mackerel) were retained in the final eDNA dataset based on the following validation criteria. Scombridae eDNA was confirmed in samples collected prior to the deployment of the baited camera systems, specifically in Sagami Bay in November 2020 and in Suruga Bay in August 2020 and August 2021. This indicates that their presence was independent of the experimental bait. Therefore, these eDNA detections were considered representative of the actual environmental profile and were included in all subsequent analyses to ensure data integrity.